Posts

Distributive Lattice Visualization

Recently, I’ve been working with lattices as data types for certain dynamical systems on networks. I wrote this blog post to show some visualization tools I wrote to help me understand morphisms of lattices. A lattice L is a partially order set with two binary operations called the meet \wedge and join \vee. The operations necessarily represent the greatest lower bound and least upper bound respectively. Moreover, we will want our lattices to be bounded, that is to say there is a greatest element T \in L and smallest element B \in L.

I needed to understand how lattices could pass information to one other i.e. to have an appropriate notion of morphism between them f : L \to K. For my purposes, functions preserving the partial order are too weak, while functions preserving both the meet and join are too strong. A happy median turns out to be join preserving functions satisfying f(a \vee b) = f(a) \vee f(b) and f(B_L) = B_K for all a,b \in L. A particularly nice property of such functions is that they admit adjoints f^\bullet : K \to L that are meet preserving, i.e. f^\bullet(a \wedge b) = f^\bullet(a) \wedge f^\bullet(b) and f^\bullet(T_K) = T_L. To stress this duality, we write join preserving maps with a lower bullet f = f_\bullet. Such a pair (f_\bullet,f^\bullet) is known as a Galois connection and they arise in many different places across mathematics. Note this slightly different from the correspondences in Galois theory, in that setting the maps are order reversing, but the two notions are highly related.

Galois connections can be somewhat daunting to visualize, so I wrote some tools to help me understand them better and build some intuition. I will restrict myself to setting of distributive lattices since Galois connections between them are highly structured. A lattice is said to be distributive if joins distribute over meets and vice-versa. In other words the following formula

x \wedge (y \vee z) = (x \vee y) \wedge (x \vee z)

(and its dual) holds for all x,y,z \in L. A theorem of Garret Birkhoff says that every distributive lattice is isomorphic to a ring of sets, hence we can realize every element of L as a set in such a way that the partial order is given by set inclusion. Below is a script depicting a distributed lattice generated by the unions and intersections of the following sets:

\{a\}, \ \{b\}, \ \{c,d\}, \ \{a,e\}, \ \{b,e\}, \ \{a,c,e\}.

Clicking on a node highlights its upper and lower neighbors, while hovering your mouse over a node displays the associated set.

Before tackling morphisms of distributive lattice, we first consider the simpler case of power set lattices. It turns out that, given two sets X and Y, every Galois connection between their power sets 2^X and 2^Y bijectively corresponds to a binary relation R \in 2^{X \times Y}. We can recover the connection via the following formula

where A \subseteq X, B \subseteq Y, and R(x,-) is the set of all y \in Y related to x. Since every distributed lattice is a ring of sets, it can be embedded into a power set lattice. In particular, for a representation of distributive lattice L, let T_L be the set representing the top element of L, then we can view L as a sublattice of 2^{T_L}. Given another distributive lattice K, we can obtain Galois connections between by inducing them from Galois connections between 2^{T_L} and 2^{T_K}. In summary, every Galois connection between L and K can be represented by a relation R \in 2^{T_L \times T_K}.

As example, consider another lattice K generated by the sets:

\{v,w\}, \ \{x,y\}, \ \{x,y,z\}, \ \{v,z\}.

We let R be the following relation between the sets T_L = \{a,b,c,d,e\} and T_K = \{x,y,z,w,v\}:

Below we visualize both lattices side by side as well as the Galois connection induced by R. The red dotted line indicates the left adjoint mapping R_\bullet : L \to K, while green dotted lines represent the mapping R_\bullet : K \to L. Hovering over a node displays its image as well as the set of elements mapping to it.

Some of the code for these examples is available in this Observable notebook or in this github repository.

The Epicycles of Ancient Astronomy

In the days of antiquity, most astronomers worked under (the rather selfish) assumption that the Earth lay in the center of the universe.  Given the predictable nature of the sun and moon, this assumption must have seemed obvious at first, but astronomers noticed some strange behavior amongst other celestial bodies. As some planets orbited the Earth, they would slow, stop, reverse direction, and then reverse direction again shortly after. This retrograde motion didn’t fit the model that all bodies simply travelled in circular paths around Earth. To address this issue, the ancient Greek astronomers Apollonius and Hipparchus developed the theory of epicycles around 200 BC.

An engraving of the Greek astronomer Hipparchus (c.190-c.120 BC) from Vies des Savants Illustres (1877).

They theorized that the planets had smaller “suborbits”, that is, they orbited a point which meanwhile orbited Earth (well not quite Earth, but a point near Earth called the eccentric). In the diagram below, the larger orbit is know as the deferent, while the smaller orbit is know as an epicycle. The model was extended to include multiple epicycles, where each epicycle recursively orbits around the previous one (see some of the gifs below).

This model of multiple epicycles works well in the sense that any observed planet’s orbit could be approximated with epicycles. Unfortunately this model works too well: a classical theorem of Fourier analysis states that any periodic function (or orbit in this case) can be approximated with such epicycles. I’ll show you what I mean.


First, we’ll need some math. Let’s represent the plane as the set of complex numbers \mathbb{C} .  A circle is parametrized by t \mapsto e^{it} which has a period of 2 \pi for t in the interval [0,\infty). We visualize t moving from 0 to 2\pi by the red dot traveling along the larger circle in the gif below. The second circle can also be parameterized, this time by the rule t \mapsto e^{-it}/10 . Notice that the red dot on the smaller circle is rotating in the opposite direction to the larger once, hence the minus sign in our parameterization. The movement of the red dot orbiting the smaller circle is therefore given by t \mapsto e^{it} + e^{-it}/10.

Generalizing this, we can consider any periodic curve of the form

\displaystyle t \mapsto \sum_{n= -N}^N c_n e^{int}

for some natural number N and complex coefficients c_n . An epicycle corresponds to a summand c_ne^{int} in the above formula. Note that we can express a complex number c_n = r_n e^{i\theta_n} where r_n is a non-negative real number and \theta_n is an angle between 0 and 2\pi and hence the coefficients c_n determine both the radius and starting point of the red dot in the epicycle.

Now let’s say we’re astronomers in 2nd century BC and we want to come up with the epicycles that describe the orbit we observe of some planet. How can pick an appropriate N and c_n‘s? They key is to understand two critical properties about the exponentials \left\{ e^{int} \right\}_{n= -\infty}^\infty. The first important property is that they form a dense subset of the set of continuous 2\pi periodic functions

\displaystyle E = \left\{ f | f : \mathbb{R} \to \mathbb{C}, f(t) = f(t +2\pi) \right\}.

This fact is not obvious (and is actually more general), but it ensures that any orbit we observe in the sky can actually be arbitrarily well approximated by finite combinations of these exponentials. The second important property is that they form an orthonormal set. Recall that in linear algebra, whenever we express a vector, say (a,b,c) \in \mathbb{R}^3, we are implicitly choosing a some basis to express it. In other words, (a,b,c) is really

\displaystyle a(1,0,0) + b(0,1,0) + c(0,0,1) = ae_1 +be_2 + ce_3  .

where the e_i are the orthonormal basis vectors. Another way to express this is via the inner product \left<\cdot,\cdot\right> , so that

 \displaystyle (a,b,c) = \left< (a,b,c),e_1 \right> e_1 + \left<(a,b,c),e_2 \right>e_2 + \left<(a,b,c),e_3 \right>e_3  = ae_1 +be_2 + ce_3   .

In the same way, the c_n serve as coordinates in terms of the basis \left\{ e^{int} \right\}_{n= -\infty}^\infty. Hence we could (though we won’t in the future) express our orbit as a vector with infinity many coordinates

\displaystyle \sum_{n= -N}^N c_n e^{int} \leftrightarrow ( \dots, 0, c_{-N,}c_{-N+1}, \dots, c_{-1}, c_0, c_1,,\dots c_N, 0, \dots )  .

By the analogy with \mathbb{R}^3 , if we had an inner product \left< \cdot , \cdot \right> on E (a function space), then we would hope given some f \in E that

\displaystyle t \mapsto \sum_{n= -N}^N \left< f , e^{ins} \right> e^{int}

is a good approximation for f. Indeed it is, if we take the inner product in E to be the continuous and complex analog of the inner product in \mathbb{R}^3, i.e. for f,g \in E we define

\displaystyle \left< f, g \right> = \int_0^{2\pi} f(s)\overline{g(s)} ds .

As we take N to infinity, we get a better and better approximation of f by exponentials, which in fact converges uniformly. Now let’s see some examples.

Our function f above is a piecewise continuous function whose image in the plane looks like a triangle. We approximate it with five epicycles (N = 2) and see that it does a pretty decent job. It only has trouble with the sharp corners, which has to do with the smoothness of the functions e^{int}, so we’ll need a much larger N to make it more precise.

Here’s an example of various levels of precision when approximating the blue path below:

Above we have (roughly) the same curve approximated with five, fifteen, and thirty-one epicycles.

As we can see, if one models the orbits of plants with epicycles, there’s no reason why some of the above curves couldn’t be the paths of planets near Earth. It was only until Kepler did these theories fall out of favor and become replaced with his model of elliptical orbits. All of the above gifs were made (by me) in Processing, a language geared towards visual arts. Some (very hacked together) code is available on my github.

Farey Graphs

Over the summer of 2018, I was a part of the ICERM REU where I worked on a project about Farey Graphs (joint work with J. Gaster, E. Rexer, Z. Riell, and  Y. Xiao). We made a lot of beautiful pictures and proved some interesting results that I want to show off and say a little about.

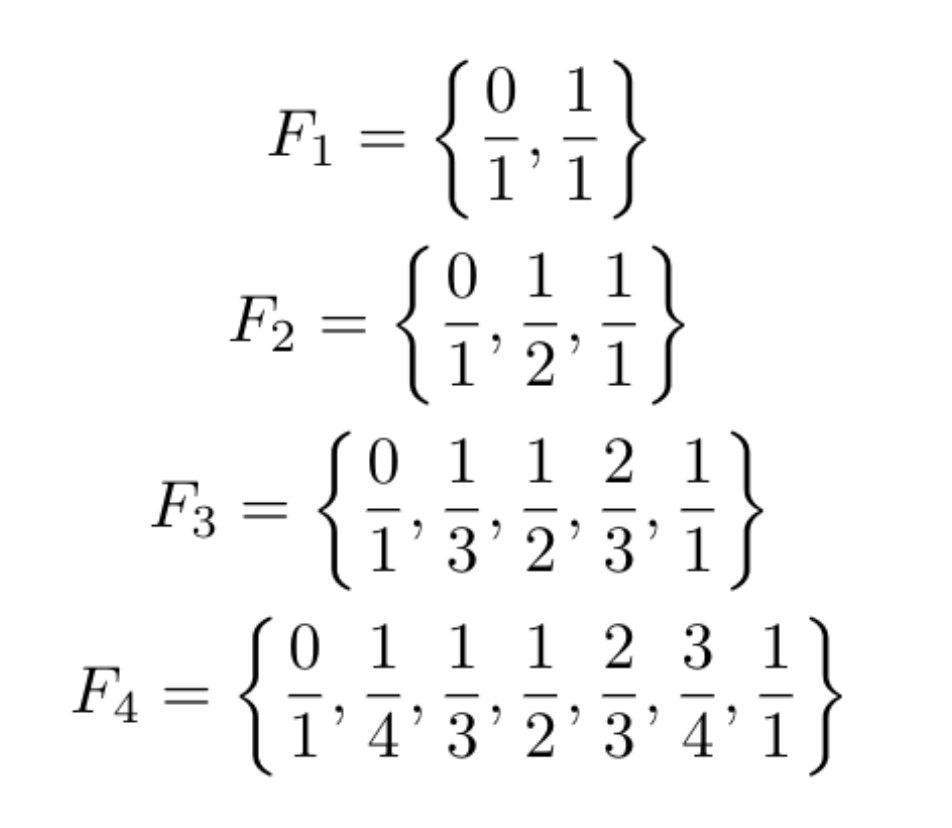
The nth Farey sequence F_n is a list of fractions named after Sir John Farey, a British mathematician who was not actually the first to discover them. The original discoverer, Charles Haros, wrote about them 14 years prior (an example of Stigler’s Law) unbeknownst to Farey. The first few sequences are as follows:

To define the terms of each sequence, we let the operation \oplus between two rational numbers be

\displaystyle \frac{a}{b} \oplus \frac{c}{d} = \frac{a+b}{c+d}.

One produces F_{n+1} from F_n by inserting between each two consecutive entries a/b and c/d of F_n the rational a/b \oplus c/d. It turns out that if we continue this process infinitely, we will reach every rational between 0 and 1 having no repeated entries.

To understand this sequence geometrically, we consider a graph G = (V,E) with vertex set V = \mathbb{Q} \cap [0,1]. A pair of rational numbers (v,w) forms an edge in E if, in some F_n, v and w appear as consecutive entries.

A subgraph of G depicting the terms of 9th Farey sequence. Image via Wikimedia Commons distributed under CC BY-SA 4.0 license.

We can extend this graph to be defined on all of \mathbb{Q} plus a ‘point at infinity’ which we denote by 1/0. Adding this point yields a highly symmetric graph that can be embedded into hyperbolic space. We define the edge set of our new extended graph \mathcal{F} = (V,E) by defining (p/q, s/t) \in E whenever we have

\left| \text{det} \begin{bmatrix} p & s \\ q & t \end{bmatrix} \right| = 1

One can check that we recover G as a subgraph of \mathcal{F}. Using Poincaire’s disc model of hyperbolic space, we can visualize this graph as seen below.

In the disc model, the real numbers are wrapped around the boundary of a disc and glued at the top by the point at infinity. Hence the vertices of our graph form a dense subset of the boundary and the edges connecting them are geodesic arcs through hyperbolic space. The graph \mathcal{F} actually triangulates hyperbolic space, since the embedding has no two edges intersecting and each edge is a side of two hyperbolic triangles.

The definition of \mathcal{F} naturally leads us to a generalization: instead of having the above determinant equal to \pm 1 we define the edge set of \mathcal{F}_k to have edges when the determinant is \pm k. We call the kth graph in this family the k-Farey graph and depict \mathcal{F}_2 below.

Our team explored the connectivity of these graphs and made the following discovery: the number of connected components of \mathcal{F}_k is given by

 b_0(\mathcal{F}_k) = \begin{cases} p^{\ell -1}(p + 1) & k = p^{\ell} \\ \infty & \text{otherwise} \end{cases}

where p is a prime number and \ell > 0 is a positive integer. For example \mathcal{F}_7 has eight connected components shown below, where each is colored by its corresponding component.

Moreover, each connected component of \mathcal{F}_7 is a planar graph; one such component is shown below.

We also have results on the automorphism groups, chromatic numbers and dual graphs of the \mathcal{F}_k, so check out the paper on arxiv to learn more!
 
Below is a gallery of some \mathcal{F}_k‘s, all of which were made in Mathematica by me. Notice anything patterns for certain integers? Let me know!

k = 29

k = 50

k = 64

k = 101