Effects of Economic Austerity on Pro-Sociality: Evidence from Greece
Authors: Nicholas Sambanis (Penn), Anna Schultz (Penn), and Elena Nikolova (University College London)
The European debt crisis gave rise to policies of fiscal austerity designed to instill discipline and return economies to growth after a short-lived period of structural adjustment. Greece received several bailouts conditional on implementing severe spending cuts and structural reforms. These policies – many of them poorly implemented – led to a prolonged period of recession. While the economic effects of austerity policies and the political causes of the crisis have been studied extensively, less is known about their social impact. We explore the effects of the crisis on pro-sociality using new household-level survey data and quasi-behavioral evidence from Greece. We focus on the effects of joblessness, the most severe outcome of the economic downturn. We posit a psychological mechanism through which joblessness decreases solidarity with others. We find evidence of a decrease in pro-sociality, measured by a decline in charitable giving at all levels of income among those who lost their jobs relative to those who didn’t; and we also find evidence of in-group bias in charitable giving. The bias is more pronounced among individuals with joblessness, a key measure of greater exposure to the consequences of austerity policies. However, we also find that this bias is only weakly mediated by beliefs that foreigners are to blame for the economic crisis.
In the Figure below, we plot donations to charities across income levels by joblessness status drawing on our new data from Greece in 2015-2016.
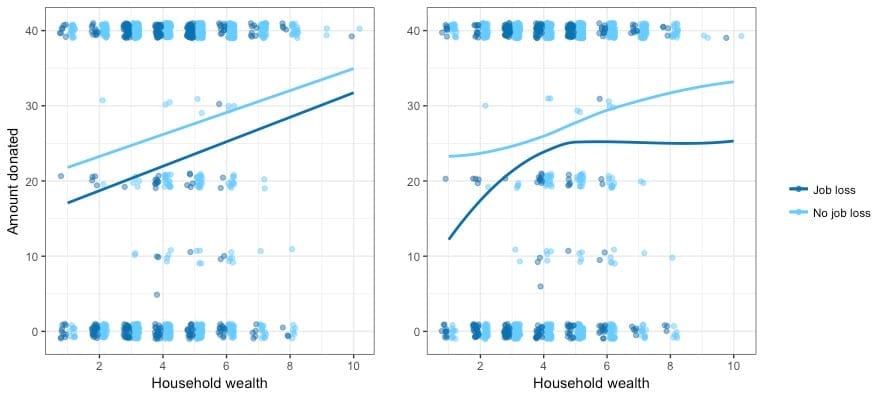
Figure 1 plots charitable giving against household wealth using the wealth/income ladder variable from our survey for households with and without job loss. We see a fairly consistent difference in giving, between those that experienced job loss and those that did not, at all levels of wealth (panel 1 shows a linear; panel 2 shows a loess fit). What you see is the level of giving plotted against wealth, sorted by whether or not individuals experienced job loss. Amount donated is on the Y-axis. Dark blue lines indicate linear fit (left) or loess (right) of giving against wealth for households with job loss during the crisis. Light blue lines indicate the same for those households that did not experience job loss.
Read a summary of the argument in a brief op-ed published in the Monkey Cage (Washington Post).